I recorded this as an issue in Endpoint GitHub repo, but it’s particularly weird and I wondered if others also see this behavior.
Might be JIT effect?
Looking at the Endpoint library code may also provide insight.
I can see a pattern, it actually seems to “hang” the first time it makes calls that invoke an interop Sys.GetUnixRelease. That itself then calls various managed string related functions.
The code transitions from managed, then to the interop native Sys.GetUnixRelease and then that calls back into managed code like Marsha.PtrToString.
That suggests to me that something odd is happening to do with the transition from native back to managed. Here’s a different hang, different test app:
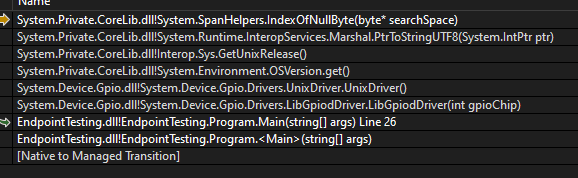
That’s what the stack looks like after I forcibly break during debug.
Also if I detach the debugger while the code is “hanging” it continues fine, so this is something to do with a debugger being attached, calling into that native layer an doing so inside an async function.
I added this to the GitHub issue.
Lots of things are loaded on demand. Check the speed of your SD.
Ran this at the start of a program:
var start = DateTime.Now;
var ps = Environment.Version;
var elapsed = DateTime.Now - start;
Console.WriteLine($"{elapsed}");
The result in the debugger was:
00:00:00.1484367
========================
Then ran the following code which gets version twice:
var start = DateTime.Now;
 var ps = Environment.Version;
 var elapsed = DateTime.Now - start;
 Console.WriteLine($"{elapsed}");

 start = DateTime.Now;
 ps = Environment.Version;
 elapsed = DateTime.Now - start;
 Console.WriteLine($"*** {elapsed}");
Got the following results:
00:00:00.1386143
*** 00:00:00.0005860
JIT in action?
Change the console app’s Main signature to this:
static async Task Main(string[] args)
then rerun those tests
That is the signature I used.
Have you tried a fresh OS on a fast SD?
No, this is the image I downloaded recently:
endpoint_image_B0100.2.2.24.img
The behavior only happens when the Main method is async otherwise things seem to behave very normal.
I thought this might be an issue with a corrupted SD. In the current situation, this is something I would try.
I did not see the issue with an async Main.
Have you tried a simple program which only contains the version code?
Its odd that you do not see this behavior. I found a workaround, simply do explicitly what the compiler does implicitly and it runs fine, absolutely no issues.
I been called worse things than “odd”. ![]()
Something in your situation is making this issue appear.
I suggest a simple program on a virgin SD (with OS). If that works it would give us lots of clues.
Crazy idea… try another USB cable?
I’m satisfied that this is a flaw, a bug. If nobody else can repro then sure, it’s likely something at my end. The behavior is not something I can see as being caused by anything obvious like cables or SD card speeds, if it is then that is an even worse bug IMHO.
I’m curious to see if nobody else sees this, the fact that you cannot is itself useful to know. I’ve used .Net and C# since 2001 and did a great deal of async and interop into Win32 C libraries using the old APM design. I’ve seen my fair share of weird behaviors and everything about this tells me there’s a problem, somewhere in the code, either Microsoft, GHI or whatever but I do smell a rat…I’m quite sure too that the GHI team will have ideas about it, assuming of course that it’s not only me with the issue!!
Okay. Maybe GHI can reproduce the problem.