Shortening variable names should not affect RAM usage. The MSIL code generated from your source code contains fully-qualified type names, but lives exclusively in ROM space. Things that will save RAM are:
Pre-allocate buffers and minimize the use of ‘new’ to reduce memory churn and fragmentation (and GCs)
Use bits and bitwise operators instead of bools
Use structs instead of classes for data objects and specify tight packing (not sure whether this helps in netmf - haven’t tried it)
Use int8, uint8, int16 and uint16 instead of int wherever possible without risking over/underflow
Use arrays instead of ArrayList
Use ASCII (arrays of uint8) instead of string for things that will be emitted as 8-bit ASCII or compared to ingested ASCII rather than using the System.Text.Encoding functions to convert to/from strings
Examine your algorithms and trade time for space when faced with a space/time trade-off
Define fixed tables in ROM instead of RAM (may require native code)
…oh, and avoid string concatenation wherever possible because that creates lots of copies of strings. For instance, it is better to output foo; and output “\r\n” than to output foo + “\r\n”. Certain string mutation operations use up to 2x the size of the input arguments. += in general is a Bad Thing to do in memory constrained managed language apps.
Your advice is very much appreciated. I had already switched from strings to arrays except in one case:
Debug.print(string)
Aha! Calls to this function exist even in the IL of release mode. Which means maybe the concatentions I use in these strings is also part of the release code.
Does Debug.Print really run when the debugger is not attached? How about all the concats?
I do it like this:
Debug.Print("I'm going to print this value: " + thisValue.ToString());
Yes and yes! We can probably take out print in the future for release but this will not remove concats. I doubt the compiler is smart enough to go inside the function to see if it is doing anything with the argument. So the strings will get handled regardless of what will happen to them.
The good news is that you may get out of memory when try to allocate a large object because of fragmentation but allocating a string would likely still work.
It left a small enough problem that I was able to identify and tackle the bulk of a now manageable list of memory issues.
But I’m not out of the woods yet.
When I run in the debugger I left one print: When I press a button on my device it runs:
Debug.Print(Debug.GC(true).ToString());
In my app there’s a hefty init from the companion app sending over data. If I force a GC before and after creating objects based on this data stream then I get in a state where I can use my device for a long time and everytime i press my Debug Button it prints
6316
So I thought I had some room to increase my output capabilities. I extended my output buffers from 15 x 100 byte buffers to 20 x 100 byte buffers.
Now I cant even run the app in the debugger. It nonstop throws out of memory exception. Failed on 33 blocks 478 bytes here, 17 blocks 227 blocks there. It’s constant, on the most random lines of code that I would never even assume would allocate memory.
The common theme in these lines is a Call. So whatsup does it take 200+ bytes to make a call? I thought I had 6316 - ~500 bytes for the new buffers anyway?
Assuming these are actually “failed to allocate memory” errors, this is a soft-fail and it allocated the space after GC and compaction. I see you’ve previously asked about this, and short of splrinkling more debug.gc(true) around the place, not sure what you can (or should) do. GC will have an overhead, but if memory is tight and processing power is not, it might help
When memory gets tight, you have consider looking for opportunities to pre-allocate storage. It is likely that you have available memory, but the heap has become fragmented. If you analyze your memory allocation sequences, you might find opportunities for pre-allocation.
Oh okay, yes, I have these soft errors… but it also throws OutOfMemory exceptions. I catch these and just let it truck along, aware that whatever was supposed to happen didn’t. Which in general seems fine to me.
Staying alive is important to me.
It’s not foolproof though. Sometimes it just can’t be caught. My thoughts were that maybe something below my code can throw out of memory and that is when it finally crashes.
What I’m a bit stuck on right now is why I am running out of memory. I should have, call it 5kB available, and I am not even calling “new”, not ever, What’s trying to allocate memory now?
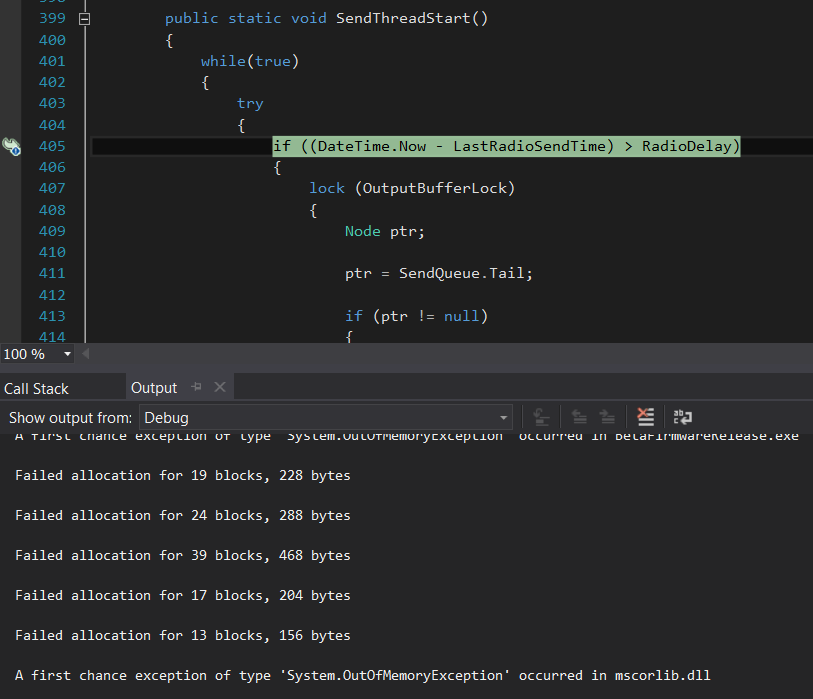
For instance, this highlighted line is claimed to be the next line that will execute when the thread returns from it’s current function, this is where I stopped the program on an out of memory exception:
So what does this mean? Does Try { } allocate memory?
Another one that commonly throws out of memory, and the line gets highlighted in yellow instead of blue, is a function call with a few primitive arguments and some “out” primitive arguments.
Aspects of this make sense to me. For instance the largest failed allocation soft error said 468 bytes, and I’m aware that my app is stable if my output buffers use just 500 less bytes. I don’t know how to deal with the blocks idea. But really I’m just trying to figure out what does and what doesn’t cost RAM.
@Justin Ha! I would love to take this advice, but I might need a time machine first.
I’m still tackling these issues slowly but surely. I realized that BitConverter was possibly not my friend so I got rid of that.
And now I’m looking for more ways to preallocate.
My Deserializer for my big init from the data stream is broken up into a lot of functions. the stack goes deep. I can’t avoid looping to allocate objects but I’m wondering now if I allocate everything in one function, even with loops, if I will get better results.
My other current theory is that just about everything I can do costs memory and maybe ~6kB is just what my program needs at all times to live and breathe. I think I remember hearing that the stack is implemented on the heap.
Edit: Ehh BitConverter and other manufacturers of small byte arrays get cleaned up nicely it would seem.
Is it really that easy? Lemur will run on the 412?
Anyway I got it up to 9kB available after init and it’s looking like reliability is way up.
But having all the extra RAM of the 412 would be great for future-proofing.
Hardware wise 401,411 and 412 are exactly the same. You can up the clock from 84 to 96mhz for the 411 and 412 and to get the extra ram and flash you need to tweak a couple of memory map files. Easy… And think of the extra ram… Oooooo lovely ram